Layout Editor
/onestopreporting/help/report-designer/creating-reports/layout-editor
section
2024-08-07T11:22:23+03:00
# Layout Editor
The **Layout Editor** is primarily used for managing filters, grouping/sorting and functions for cell, row, column, and sheet level business rules, as well as [Storage rules](./../../../budgeting/create-budget-template-in-report-designer).
Click the **Layout Editor** button in the **OneStop Reporting** Excel ribbon to open the **Layout Editor.** The various functions in the **Layout Editor** are explained in the next sections.
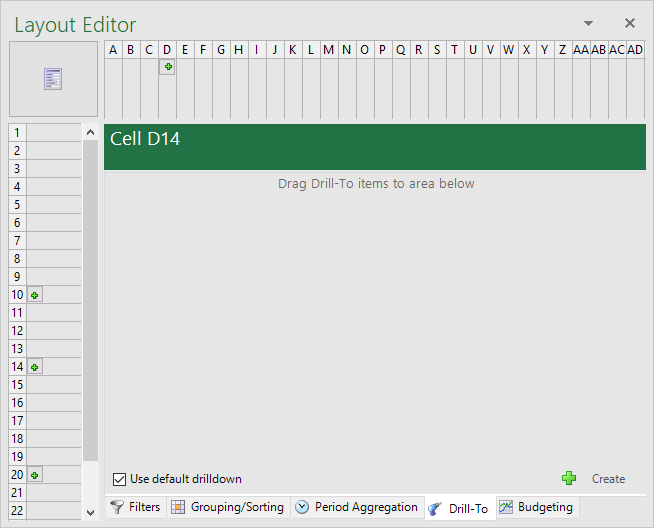
*Figure: Layout Editor - Report Designer*
Filters
/onestopreporting/help/report-designer/creating-reports/layout-editor/filters
section
2024-08-02T13:54:26+02:00
# Filters
Creating and managing filters is a key feature in designing a report definition. You can apply filters to groups created at sheet, row, column, or cell level. To create a filter;
- Drag an item from the **Report Designer** menu into the appropriate area on the **Filters** tab in the **Layout Editor** (area below the text *Drag fields into area below to create filters*). An example is shown in the figure below.
*Figure: Apply filters*
You can access existing filters by clicking on the boxes in the respective row or column, as shown in the figure below. From the **Layout Editor** window, you can modify and delete filters.
*Figure: Accessing filters in the Layout Editor*
The next sections cover the basics of configuring filters:
Dimension Lookup
/onestopreporting/help/report-designer/creating-reports/layout-editor/filters/dimension-lookup
page
2026-01-16T14:27:01+01:00
# Dimension Lookup
Filters can further be configured by using the *dimension lookup* function:
1. Click the **D****imension lookup** button  to display the attributes available to filter for the specific dimension.

2. In the **Lookup** dialog box, you can specify the dimension to remain *static* or *dynamic* depending on the report requirements.
To create a static filter, select the **List** tab in the **Lookup** window. Select the desired account, department, entity, etc. and click **OK**.
**Use ranges** checkbox: If this checkbox is selected and multiple data items are selected, the selected data are displayed as a range in the text box at the bottom of the window. If this checkbox is not selected, all selected data are displayed individually in the bottom text box.

To manually create a parameter, enter {@Dimension_Name}.
For *Period* dimensions, you can specify the value *current period +/-* for single period parameters. This allows **Report Designer** to select the correct period based on the computer date; therefore, report parameters do not need to be updated manually prior to running a scheduled report.
Operators
/onestopreporting/help/report-designer/creating-reports/layout-editor/filters/operators
page
2026-01-16T14:27:01+01:00
# Operators
Using operators is one way you can create a customized filter. Similar to operators in mathematics or programming languages, the operators dictate an action or procedure taken by the **Report Designer**.
*Figure: Filter operators in Report Designer*
In the first drop-down box, these two options are available:
| **Option** | **Function** |
|---|---|
| *blank* | Will include all data inside the specified filter. |
| **Not** | Will include all data outside the specified filter. |
If there are multiple filters in the same group, these options will also be available in the first drop-down box:
| **Option** | **Function** |
|---|---|
| **And** | Will filter the first condition AND the second condition. |
| **Or** | Will filter the first condition OR the second condition. |
| **And Not** | Will filter the first condition AND NOT the second condition. |
| **Or Not** | Will filter the first condition OR NOT the second condition. |
In the second drop-down box, these filter operators are available:
| **Option** | **Function** |
|---|---|
| **In** | *dimension* is In... (the selected parameters) |
| **\<\>** | *dimension* is Not equal to... (the selected parameters) |
| **\<** | *dimension* is Less than... (for numerical values) |
| **\>** | *dimension* is Greater than... (for numerical values) |
| **\<=** | *dimension* is Less than or equal to... (for numerical values) |
| **\>=** | *dimension* is Greater than or equal to... (for numerical values) |
| **Begins with** | *dimension* Begins with... (for any phrase contained in the dimension) |
| **Ends with** | *dimension* Ends with... (for any phrase contained in the dimension) |
| **Contains** | *dimension* Contains... (any part of the phrase contained in the dimension) |
| **Like** | **OSR Report Designer** will retrieve any data using "LIKE ..." in SQL.\* |
\*The **Like** operator is for advanced users and requires knowledge of SQL.
Grouping and sorting
/onestopreporting/help/report-designer/creating-reports/layout-editor/grouping-and-sorting
section
2026-01-16T14:27:01+01:00
# Grouping and sorting
Access grouping and sorting by clicking the **Grouping/Sorting** tab in the **Layout Editor** window.
> [!TIP]
> The *Grouping/Sorting* tab is not available if the report level is selected. In addition, grouping will not occur if the *Expanding* checkbox is deselected.
*Figure: Grouping and sorting options*
| | **Icon** | **Function** |
|---|---|---|
| **1** |  | Increase or decrease the precedence of the data item in the sorting order. |
| **2** |  | Select the display option of the row, column, or cell. The available options are *None*, *Group*, *Sum*, *Min*, *Max*, and *Count*. |
| **3** |  | If this icon is displayed, the sorting is in ascending order for the group. Click on this icon to cycle through the sorting options. |
| **3** |  | If this icon is displayed, the sorting will not exist for the group. Click on this icon to cycle through the sorting options. |
| **3** |  | If this icon is displayed, the sorting is in descending order for the group. Click on this icon to cycle through the sorting options. |
| **4** |  | Delete the data item from the **Grouping/Sorting** tab. |
Grouping
/onestopreporting/help/report-designer/creating-reports/layout-editor/grouping-and-sorting/grouping
page
2024-08-02T13:54:26+02:00
# Grouping
**Report Designer** will automatically display data items on row or column level if a *dimension* or *light dimension* is dragged into a cell and a group already exists on the row or column level. An example is shown in the figure below.

In essence, grouping the *account* dimension displays results at the account level even if there are detailed sub-accounts. If the account data field is not grouped, the report will display all sub-accounts at the time of execution.
For more details on grouping, see [Expanding Groups.](./../../expanding-groups)
Sorting
/onestopreporting/help/report-designer/creating-reports/layout-editor/grouping-and-sorting/sorting
page
2024-08-02T13:54:26+02:00
# Sorting

On column and row level, dimensions can be reordered to create a hierarchy of sorting by clicking the arrow buttons next to the dimension name. For example, in the settings shown in the illustration above, the generated report will be presented in numerical order of account number (as shown in the illustration on the left below). However, if the *Description* dimension is moved to take precedence over *Account*, the generated report will be presented in alphabetical order of the account description (as shown in the illustration on the right below).

In addition, **Report Designer** will automatically display data items in the **Layout Editor** on cell level if a *measure* has been dragged into a cell and a group already exists on the row or column level. The same options are available for cell level grouping and sorting. The illustration below shows an example.

Period aggregation
/onestopreporting/help/report-designer/creating-reports/layout-editor/period-aggregation
page
2024-07-04T17:39:28+02:00
# Period aggregation
From the **Period Aggregation** tab, you have the option to aggregate data.
Aggregation of data involves displaying *total* financial figures for each month, instead of displaying financial figures for *one* month.
Expanding groups
/onestopreporting/help/report-designer/creating-reports/layout-editor/expanding-groups
section
2026-01-16T14:27:01+01:00
# Expanding groups
*Expanding groups* are an essential part of the **Report Designer**. It involves, for example, creating a list of each account rather than grouping the accounts together and displaying a total for all accounts.
## Create expanding groups
To create expanding groups;
1. In the **Layout Editor** window, select the **Expanding** checkbox to create expanding groups in the specified row or column for data items that have been set to **Group** in the **Grouping/Sorting** tab.
> [!TIP]
> The quickest way to create an expanding group is by dragging a data item, such as *Sales Person* into the report definition and selecting *Create a new selection group on the Row* or *Create a new selection group on the Column*. By default, *Report Designer* creates an expanding group and shows the group in the *Grouping/Sorting* tab in the *Layout Editor* window.

*Figure: The process of creating expanding groups in the Layout Editor*
> [!TIP]
> If the row/column is an expanding group, it will be indicated by a small green plus icon  in the box of the respective row or column.
If the report is generated and an expanding group is *not* created, the report will result in consolidation of all data in the account, as shown in the figure below.
*Figure: Report with no expanding group*
On the other hand, if an expanding group is created, the details of the account will be given, as shown in the figure below.
*Figure: Report with an expanding group*
Expanding Groups in an Expanding Group
/onestopreporting/help/report-designer/creating-reports/layout-editor/expanding-groups/expanding-groups-in-expanding-groups
page
2024-08-07T11:22:23+03:00
# Expanding Groups in an Expanding Group
To create more flexible reporting, you can create expanding groups inside other expanding groups to create *nested* expanding groups.
An expanding group inside another expanding group can be thought of as a hierarchy. Imagine there are two data sets, one alphabetical and the other numerical (A, B, C... & 1, 2, 3...), and one is an attribute of the other.
## Create a nested expanding group
1. Drag the relevant data items into the report definition.
2. In the **OneStop Reportin**g dialog box, click **Create a new selection group on the Row**. **NOTE:** The two data items must be placed in consecutive rows.

By default, **Report Designer** creates two separate expanding groups. However, you want to create a nested expanding group.
3. In the **Layout Editor** window, drag the expanding group box so that it extends over multiple rows.

The reports for separate expanding groups (left) and a nested expanding group (right) are shown in the figure below.

Advanced period formulas
/onestopreporting/help/report-designer/creating-reports/layout-editor/advanced-period-formulas
page
2026-01-16T14:27:01+01:00
# Advanced period formulas
In **Report Designer,** you have the possibility to use predefined period functions during the report building. In cases where these features do not meet your needs, you can use advanced period formulas to determine the year, period(s) or day(s) in the report. This guide explains how to use such formulas in Report Designer.
## Advanced period formulas
When you work on advanced period formulas, you often have to relate to two variables in each formula.
Example:
{PeriodCalc.GetPeriod(Parameter).AddYears(X).WholeYear}
*Parameter* is the period parameter created in the report, and *X* is the variable that determines the number of years, months/periods and days that the formula should add or subtract.
> [!NOTE]
> In some cases, there will be a third variable, represented by Y in the example with a rolling interval further down in this document.
> [!IMPORTANT]
> Advanced period functions are calculations based on the parameter value that is selected when the report is run. Due to this, users can only select a single period to run the report for when advanced and the predefined period functions are used.
Figure 1 shows where to find and replace the parameter for the period.
1. In the **Layout Editor**, click the group to enter the expansion.
2. Click the **Lookup** button to do a lookup. In the **Lookup** dialog, you can see the name of the parameter (marked in blue).
3. Copy the text within {}.
4. Paste this in to replace the text *Parameter* in the formulas described in this document.


*Figure 1 Finding and replacing the parameter for the period*
## Period formulas based on a monthly ID (e.g. Period=201801 for January 2018) {#period-formulas-based-on-a-monthly-id-e.g.-period201801-for-january-2018}
The table below shows various period formulas where you can replace (Parameter) with (PostingPeriods)^1^ and replace the variable X with the number of years/months you want to add or subtract. The formula element *Extend* determines how many months to add to an interval. More examples of built-in period functions will follow in the section *Overview of the built-in period functions in Report Designer* below.
| Period function | Period formula |
|----|----|
| Whole year in year X | ```'{PeriodCalc.GetPeriod(Parameter).AddYears(X).WholeYear}'``` |
| First period in year X | ```'{PeriodCalc.GetPeriod(Parameter).AddYears(X).YearStart}'``` |
| Last period in year X | ```'{PeriodCalc.GetPeriod(Parameter).AddYears(X).YearEnd}'``` |
| Q1 of year X | ```'{PeriodCalc.GetPeriod(Parameter).AddYears(X).YearStart.Extend(2)}'``` |
| Q2-Q4 in year X | ```'{PeriodCalc.GetPeriod(Parameter).AddYears(X).YearStart.SetIndex(X).Extend(2)}'``` |
| Remaining periods in year X | ```'{PeriodCalc.GetPeriod(Parameter).AddYears(X).Add(1)}':'{PeriodCalc.GetPeriod(Parameter).AddYears(X).YearEnd}'``` |
| This period year X | ```'{PeriodCalc.GetPeriod(Parameter).AddYears(X)}'``` |
| Current month | ```'{PeriodCalc.CurrentPeriod}'``` |
| Rolling from X to Y | ```'{PeriodCalc.GetPeriod(Parameter).Add(X).Extend(Y)}'``` |
^1^The term used varies between ERP systems. Look for the period parameter, such as Periods, Posting Periods, Accounting Periods, etc. in the **Layout Editor**. (See Figure 1 above for where to look.)
## Example of formula for rolling interval from X to Y
If you want to show 2 years of rolling history, then you must first subtract 1 month (from the period parameter you select when you run the report), and then extend (Extend) with 23 months.
Here, X gets the value -1 and Y gets the value -23.
The formula would like this:
{PeriodCalc.GetPeriod(PostingPeriods).Add(-1).Extend(-23)}
## Period Formulas based on date ID (format dd.mm.yyyy -- e.g. 01.01.2019) {#period-formulas-based-on-date-id-format-dd.mm.yyyy-e.g.-01.01.2019}
The table below shows various period formulas where you can replace (DateParameter) with a date parameter^2^ and replace the variable X with years/months you want to add or subtract. You find the parameter in the same way as in the example above. The only difference is that you have a period dimension based on day level, for example, posted date.
| 0 | 1 |
|------------------|----------------------------------------------------|
| Date parameter | Period formula |
| Year | ```'{DateParameter.AddYears(X).SqlDate}'``` |
| Months | ```'{DateParameter.AddMonths(X).SqlDate}'``` |
| Days | ```'{DateParameter.AddDays(X).SqlDate}'``` |
| Day Y, in year X | ```'{DateParameter.AddYears(X).AddDays(Y).SqlDate}'``` |
> **NOTE:** When the period formula is based on a date, as opposed to a period (month), you must include ' before and after the formula:
```'{DateParameter.AddYears(X).SqlDate}'```
^2^The term used varies between ERP systems. Look for date parameters such as Due Date, Transaction Date, etc.
## Example of formula for day Y in year X
In this example, you want to find yesterday last year. You can do this by replacing -1 Y with -1. The formula will then subtract 1 year minus 1 day for the date you set when you run the report.
```'{DateParameter.AddYears(-1).AddDays(-1).SqlDate}'```
'{DateParameter.AddYears(-1).AddDays(-1).SqlDate}'
This is a period formula based on date. It calculates date based on current date/today's date
## Example of formula with Due Date
In this example, you want to show invoices that are due in the next 30 days, based on a date parameter, @DueDate. You can do this by using this formula:
```'{@DueDate.AddDays(30).SqlDate}'```
## Overview of the built-in period functions in Report Designer
| Name | Display Name | Expression |
|----|----|----|
| ALL2Yago | All Year 2 Years Ago | ```'{PeriodCalc.GetPeriod([]).AddYears(-2).WholeYear}'``` |
| ALL2Yfor | All Year 2 Years Forward | ```'{PeriodCalc.GetPeriod([]).AddYears(2).WholeYear}'``` |
| All3YAgo | All Year 3 Years Ago | ```'{PeriodCalc.GetPeriod([]).AddYears(-3).WholeYear}'``` |
| All3YFor | All Year 3 Years Forward | ```'{PeriodCalc.GetPeriod([]).AddYears(3).WholeYear}'``` |
| AllTimeTD | All Time to Date | ```'{PeriodCalc.GetPeriod([0])}':'{PeriodCalc.GetPeriod([])}'``` |
| FPLY | First Period Last Year | ```'{PeriodCalc.GetPeriod([]).AddYears(-1).YearStart}'``` |
| FPNY | First Period Next Year | ```'{PeriodCalc.GetPeriod([]).AddYears(1).YearStart}'``` |
| FPTY | First Period This Year | ```'{PeriodCalc.GetPeriod([]).YearStart}'``` |
| LPLY | Last Period Last Year | ```'{PeriodCalc.GetPeriod([]).AddYears(-1).YearEnd}'``` |
| LPNY | Last Period Next Year | ```'{PeriodCalc.GetPeriod([]).AddYears(1).YearEnd}'``` |
| LPTY | Last Period This Year | ```'{PeriodCalc.GetPeriod([]).YearEnd}'``` |
| LY | Last Year (all) | ```'{PeriodCalc.GetPeriod([]).AddYears(-1).WholeYear}'``` |
| LYTD | Last year to date | ```'{PeriodCalc.LastYearToDate([])}'``` |
| NY | Next Year (all) | ```'{PeriodCalc.GetPeriod([]).AddYears(1).WholeYear}'``` |
| Q1LY | Q1 Last Year | ```'{PeriodCalc.GetPeriod([]).AddYears(-1).YearStart.Extend(2)}'``` |
| Q1TY | Q1 This Year | ```'{PeriodCalc.GetPeriod([]).YearStart.Extend(2)}'``` |
| Q2LY | Q2 Last Year | ```'{PeriodCalc.GetPeriod([]).AddYears(-1).SetIndex(4).Extend(2)}'``` |
| Q2TY | Q2 This Year | ```'{PeriodCalc.GetPeriod([]).SetIndex(4).Extend(2)}'``` |
| Q3LY | Q3 Last Year | ```'{PeriodCalc.GetPeriod([]).AddYears(-1).SetIndex(7).Extend(2)}'``` |
| Q3TY | Q3 This Year | ```'{PeriodCalc.GetPeriod([]).SetIndex(7).Extend(2)}'``` |
| Q4LY | Q4 Last Year | ```'{PeriodCalc.GetPeriod([]).AddYears(-1).SetIndex(10)}':'{PeriodCalc.GetPeriod([]).AddYears(-1).YearEnd}'``` |
| Q4TY | Q4 This Year | ```'{PeriodCalc.GetPeriod([]).SetIndex(10)}':'{PeriodCalc.GetPeriod([]).YearEnd}'``` |
| RB12M | 12 Month Rolling (-1 -> -12) | ```'{PeriodCalc.GetPeriod([]).Add(-1).Extend(-11)}'``` |
| RBC12M | 12Month Rolling Current (0 > -12) | ```'{PeriodCalc.GetPeriod([]).Add(0).Extend(-11)}'``` |
| RF12M | 12 Months Rolling (+1 -> +12) | ```'{PeriodCalc.GetPeriod([]).Add(1).Extend(11)}'``` |
| RF3M1 | 3 Months Rolling (+1 -> +3) | ```'{PeriodCalc.GetPeriod([]).Add(1).Extend(2)}'``` |
| RF3M2 | 3 Months Rolling (+4 -> +6) | ```'{PeriodCalc.GetPeriod([]).Add(4).Extend(2)}'``` |
| RF3M3 | 3 Months Rolling (+7 -> +9) | ```'{PeriodCalc.GetPeriod([]).Add(7).Extend(2)}'``` |
| RF3M4 | 3 Months Rolling (+10 -> +12) | ```'{PeriodCalc.GetPeriod([]).Add(10).Extend(2)}'``` |
| RFC12M | 12 Months Rolling Current (0 > 12) | ```'{PeriodCalc.GetPeriod([]).Add(0).Extend(11)}'``` |
| RPLY | Remaining Periods Last Year | ```'{PeriodCalc.GetPeriod([]).AddYears(-1).Add(1)}':'{PeriodCalc.GetPeriod([]).AddYears(-1).YearEnd}'``` |
| RPTY | Remaining Periods This Year | ```'{PeriodCalc.GetPeriod([]).Add(1)}':'{PeriodCalc.GetPeriod([]).YearEnd}'``` |
| TPLY | This Period Last Year | ```'{PeriodCalc.GetPeriod([]).AddYears(-1)}'``` |
| TPNY | This Period Next Year | ```'{PeriodCalc.GetPeriod([]).AddYears(1)}'``` |
| TPTY | This Period This Year | ```'{PeriodCalc.GetPeriod([])}'``` |
| TYALL | This Year (all) | ```'{PeriodCalc.GetPeriod([]).WholeYear}'``` |
| YTD | Year to Date | ```'{PeriodCalc.FiscYearToDate([])}'``` |
## Additional Period Syntax
The following syntax can be applied within the period filter.
*DateParameter = name of period parameter*
| Expression Syntax | Example |
|----|----|
| AddDays(n) | 1. ```'{DateParameter.AddDays(30).SqlDate}'``` 2. ```'{DateParameter.YearEnd.AddDays(1).SqlDate}':'2020-12-31 AddMonths(n)``` |
| AddYears(n) | ```'{DateParameter.AddYears(-1).SqlDate}'``` |
| WeekStart | ```'{PeriodCalc.Now.WeekStart.SqlDate}':'{PeriodCalc.Now.SqlDate}'``` |
| MonthEnd | ```'{DateParameter.MonthEnd.SqlDate}'``` |
| MonthStart | ```'{DateParameter.MonthStart.SqlDate}'``` |
| YearEnd | ```'{DateParameter.YearEnd.SqlDate}'``` |
| YearStart | ```'{DateParameter.YearStart.SqlDate}'``` |
The functions may be combined:
```'{DateParameter.YearEnd.AddDays(1).SqlDate}':'2020-12-31```